Curriculum
GRADE VIII MATHS
Chapters
0/14
-
Square And Cube
 Preview
 -
Power Play
Preview
-
Story Of Numbers
Preview
-
Quadrilaterals
Preview
-
Number Play
Preview
-
Distribute Mutiply
Preview
-
Proportional Reasoning 1
Preview
-
Fraction In Disguise
Preview
-
Baudhayana-Pythagoras
Preview
-
Proportional Reasoning 2
Preview
-
Geometric Themes
Preview
-
Dots And Lines
Preview
-
Algebra Play
Preview
-
Area
Preview
Ganita Prakash
0/14

Dots And Lines
School Revise · Grade 8 · Maths · Chapter 12 · Ganita Prakash
Tales by Dots and Lines
Maths, Class 8, Ganita Prakash. Data tells a story once we summarise and picture it. This chapter finds the mean and median of a data set and reads the tales told by graphs.
|
|
||
|
|
What this chapter is about
A row of numbers hides a story. In this chapter we summarise data with the mean, the balancing average, and the median, the middle value, and we read and interpret bar graphs, line graphs and pie charts.
1. Mean and median
|
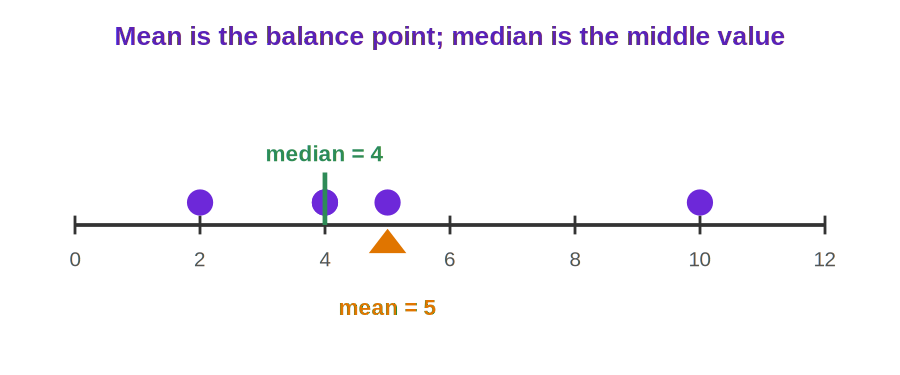
Mean and median the mean (average) is the total of all values divided by how many there are; the median is the middle value when the data is arranged in order The mean acts like a balance point of the data. For the median, sort the values first: with an odd count the median is the middle one, and with an even count it is the average of the two middle values. In real life: A cricketer’s batting average is a mean, telling us the typical runs scored across many innings. |
|
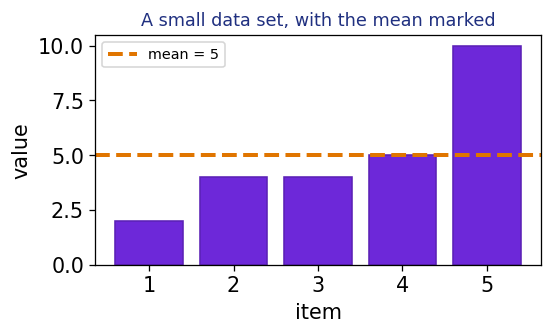
Worked example 1 Question. Find the mean of 2, 4, 4, 5, 10.
Answer: The mean is 5. |
|
Worked example 2 Question. Find the median of 2, 4, 4, 5, 10.
Answer: The median is 4. |
2. Reading graphs
|
Reading data graphs a bar graph compares amounts with bars, a line graph shows how a quantity changes over time, and a pie chart shows the shares of a whole Reading a graph means finding what each axis shows, then comparing heights, following the line’s rise and fall, or comparing slice sizes. The right graph makes the story easy to see. In real life: A hospital tracks a patient’s temperature on a line graph, so a rising fever is spotted at a glance. |
|
Worked example 3 Question. On a bar graph, one bar reaches 8 and another reaches 5. How much taller is the first?
Answer: The first bar is 3 units taller. |
Practise with the interactive
Practise it: change a data set and watch the mean balance point and the median shift, then read the story off the bar graph. The interactive opens right here in the lesson.
Practice set A, multiple choice
1. The mean is found by …
Adding all the values and dividing by how many there are.
2. The median is …
The middle value when the data is arranged in order.
3. A line graph is best for showing …
How a quantity changes over time.
4. A pie chart shows …
The shares of a whole.
Practice set B, short answer
1. Find the mean of 3, 6, 9.
| 1 | Add, 3 + 6 + 9 = 18. then divide by 3. |
| 2 | Answer. 18 ÷ 3 = 6. |
2. Find the median of 7, 2, 9, 4, 5.
| 1 | Sort: 2, 4, 5, 7, 9. five values, middle is the third. |
| 2 | Answer. median = 5. |
3. Which graph best shows a class’s favourite fruits as shares of the whole?
A pie chart, since it shows shares of a whole.
Quick summary
| Idea | The idea |
| Mean | total ÷ how many. |
| Mean acts as | a balance point. |
| Median | the middle, in order. |
| Bar graph | compares amounts. |
| Line graph | change over time. |
| Pie chart | shares of a whole. |
| Open the Virtual Lab |
These free Grade 8 Maths revision notes explain mean and median, and reading bar, line and pie graphs, with clear step by step worked examples and labelled diagrams for every student following the new Ganita Prakash book.
© 2026 School Revise. All rights reserved. This lesson is original content written by School Revise, aligned to the CBSE and NCERT Class 8 Mathematics (Ganita Prakash) syllabus. Unauthorised copying, reproduction or redistribution is not permitted. Curriculum names are used only to indicate alignment.
 Google