Curriculum
Mathematics Grade IX
Mathematics Grade 9
0/8
-
Chapter 1: Orienting Yourself: The Use of Coordinates
 Preview
 -
Chapter 2: Introduction to Linear Polynomials
Preview
-
Chapter 3: The World of Numbers
Preview
-
Chapter 4: Exploring Algebraic Identities
Preview
-
Chapter 5: I’m Up and Down, and Round and Round
Preview
-
Chapter 6: Measuring Space: Perimeter and Area
Preview
-
Chapter 7: The Mathematics of Maybe: Introduction to Probability
Preview
-
Chapter 8: Predicting What Comes Next: Exploring Sequences and Progressions
Preview
Advanced Maths
0/6
Chapter 7: The Mathematics of Maybe: Introduction to Probability
School Revise · Grade 9 Maths · Chapter 7
The Mathematics of Maybe: Introduction to Probability
Ganita Manjari, Class 9. Probability is a number that measures how likely something is, from 0 for impossible to 1 for certain. Here we learn to count outcomes, work out theoretical probability, and test it by experiment.
|
|
||
|
|
What this chapter is about
Will it rain today? Will this coin land heads? We cannot be sure, but we can measure how likely each is with a number. That number is the probability. In this chapter we place likelihood on a scale from 0 to 1, count the outcomes of simple experiments, and see how doing an experiment many times gives an answer close to the theory.
|
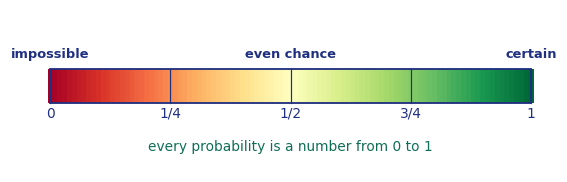
The probability scale every probability is a number from 0 to 1 A probability of 0 means the event is impossible, 1 means it is certain, and 1/2 means it is as likely as not. The closer to 1, the more likely the event. In real life: Weather forecasts use it directly, a 70 percent chance of rain is a probability of 0.7. Insurance and games of chance are built on it too. |
1. Theoretical probability
When every outcome is equally likely, we can work out the probability by counting, without doing any experiment at all.
|
Theoretical probability P(event) = number of favourable outcomes / total number of equally likely outcomes Favourable outcomes are the ones you are hoping for. Total outcomes are all the equally likely results. The fraction is always between 0 and 1. In real life: It tells a game designer the exact chance of rolling a six, and a card player the chance of drawing an ace, before a single card is dealt. |
|
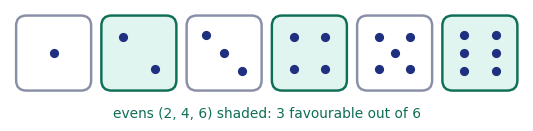
Worked example 1 Question. A fair die is rolled. What is the probability of getting an even number?
Answer: P(even) = 1/2. |
|
Worked example 2 Question. One card is drawn from a well shuffled pack of 52. What is the probability it is red?
Answer: P(red) = 1/2. |
2. The probability of an event not happening
Every experiment either gives the event or does not, and one of the two must happen. So the two probabilities always add up to 1.
|
Complement rule P(event does not happen) = 1 − P(event happens) If the chance of an event is P, then the chance of it not happening is 1 minus P, because all the probabilities together must total 1. In real life: If there is a 0.3 chance of rain, there is a 1 − 0.3 = 0.7 chance of no rain. |
|
Worked example 3 Question. The probability of rolling a six on a die is 1/6. What is the probability of not rolling a six?
Answer: P(not six) = 5/6. |
3. Experimental probability
Theory tells us a coin should land heads half the time. But if we actually toss it, we count what really happens. Experimental probability is the fraction of trials in which the event occurred.
|
Experimental probability P(event) = number of times it happened / total number of trials This is also called relative frequency. The more times you repeat the experiment, the closer the experimental probability usually gets to the theoretical value. In real life: A factory checking how often a machine makes a faulty part relies on experimental probability from real batches. |
4. Sample space and events
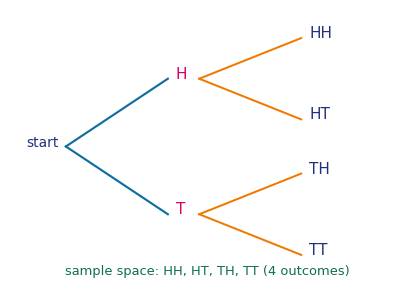
The sample space is the list of all possible outcomes of an experiment. An event is any group of outcomes we are interested in. Tossing two coins has the sample space HH, HT, TH, TT, so there are four equally likely outcomes. The event getting exactly one head is HT and TH, which is 2 of the 4, a probability of 1/2.
Try this: List the sample space for rolling two dice. How many outcomes are there in total? How many give a sum of 7?
Practise with the interactive
Toss a coin or roll a die many times and watch the experimental probability settle close to the theory. The interactive opens right here in the lesson.
Practice set A, multiple choice
1. A probability can never be …
Greater than 1 or less than 0. Every probability lies from 0, impossible, to 1, certain.
2. The probability of getting a head on a fair coin is …
| 1 | Count outcomes. Two equally likely outcomes, head or tail. |
| 2 | Apply the formula. Favourable is 1 head out of 2, so P = 1/2. |
3. On a die, the probability of a number greater than 4 is …
| 1 | Favourable outcomes. Numbers greater than 4 are 5 and 6, which is 2 outcomes. |
| 2 | Apply the formula. P = 2 / 6 = 1/3. |
4. If P(win) = 0.35, then P(not win) is …
| 1 | Use the complement rule. P(not win) = 1 − 0.35. |
| 2 | Subtract. = 0.65. |
Practice set B, short answer
1. A die is rolled. Find the probability of getting a number less than 3.
| 1 | Favourable outcomes. Numbers less than 3 are 1 and 2, which is 2 outcomes. |
| 2 | Apply the formula. P = 2 / 6 = 1/3. |
2. A bag has 4 red and 6 blue balls. Find the probability of drawing a red ball.
| 1 | Total outcomes. 4 + 6 = 10 balls, all equally likely. |
| 2 | Favourable. 4 red balls. |
| 3 | Apply the formula. P(red) = 4 / 10 = 2/5. |
3. A coin is tossed 200 times and lands heads 90 times. Find the experimental probability of heads.
| 1 | Use the experimental formula. P = times it happened / total trials. |
| 2 | Substitute. = 90 / 200. |
| 3 | Simplify. = 9/20, which is 0.45. |
Quick summary
| Idea | The idea |
| Probability scale | A number from 0 (impossible) to 1 (certain). |
| Theoretical | favourable / total equally likely outcomes. |
| Complement | P(not A) = 1 − P(A). |
| Experimental | times it happened / total trials. |
| Sample space | the list of all possible outcomes. |
| Open the Virtual Lab |
These free Grade 9 Maths notes explain probability, the probability scale, theoretical and experimental probability, sample spaces and events, with clear step by step worked examples and daily practice for students using the new Ganita Manjari book.
© 2026 School Revise. All rights reserved. This lesson is original content written by School Revise, aligned to the CBSE and NCERT Class 9 Maths syllabus. Unauthorised copying, reproduction or redistribution is not permitted. Curriculum names are used only to indicate alignment.
 Google